Puck Analytics
NHL data pipeline & visualization platform
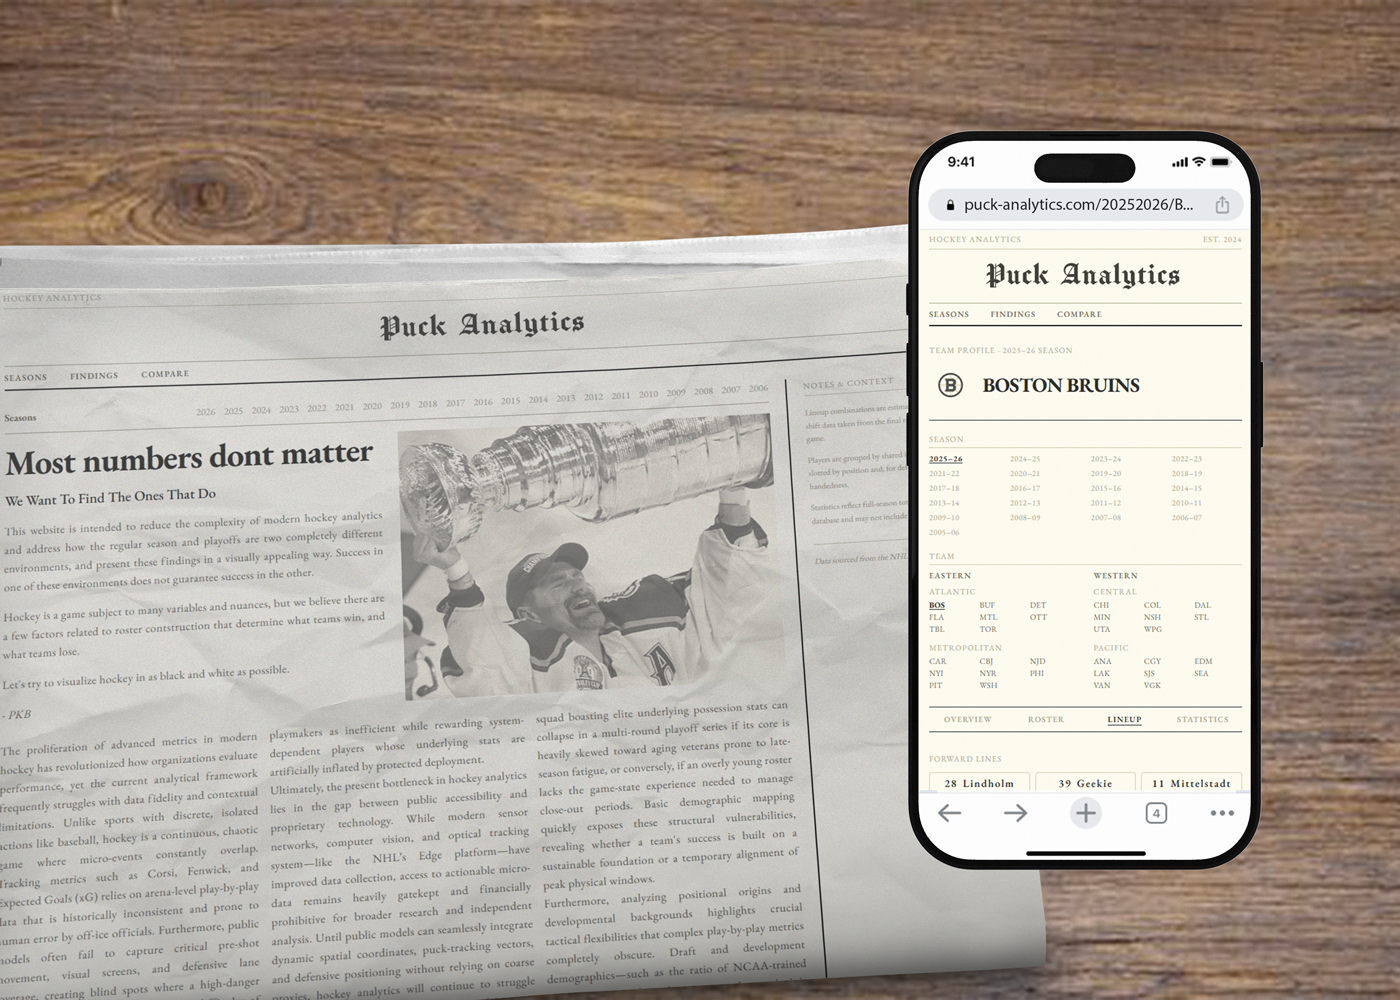
This project was commissioned to narrow the scope of modern hockey analytics and analyze the impact of non-conventional metrics on roster construction.
Designer & Developer
2026 - present
puck-analytics.com
In Progress
Problem
The client believed that modern analytics were not helpful and wanted to analyze the impact of several non-conventional metrics on roster construction.
Solution
A PostgreSQL database ingests and normalizes data from the NHL Stats API, while a Next.js dashboard surfaces interactive visualizations — shot charts, player trends, and team performance breakdowns — without requiring SQL knowledge.
Steps
Database
Designed a normalized PostgreSQL schema and Python ETL pipeline to ingest play-by-play event data from the NHL Stats API.
UI/UX Design
Wireframed and prototyped dashboard layouts in Figma with progressive disclosure for casual fans and power users alike.
Development
Built an interactive Next.js dashboard with d3.js visualizations, backed by a Node.js API querying the Postgres database.
01
SkipDatabase
Purpose
Why create a database instead of fetching data from the existing API?
The NHL API was missing several key associated data points, and had some other inconsistencies:
-
Player amateur league data was not associated with any player related endpoints.
The NHL API does not provide direct amateur league data for players, which is important for analyzing player development and performance. Because this was the top ask from the client, it was necessary to create a database that could fill in this missing data point.
-
Player draft position and year were not associated with any player related endpoints.
The NHL API does not provide direct draft position and year data for players, which is important for analyzing player development and performance.
-
Inconsistent roster data existed for players who have been traded mid-season.
Inconsistent roster data resulted in gaps in inferred line combinations.
-
The existing API can still be leveraged for certain data points
By preserving team and player IDs from the NHL API, the existing API can still be leveraged for certain data points, such as player statistics and team information.
Methods
Creating and hosting the database
Python was utilized to fetch existing data from the NHL API and to fill in the missing data points. The data was then normalized and stored in a PostgreSQL database.
-
Player ameture league was deduced from the last played league prior to the NHL from the player statistics endpoint.
-
Player draft position and year was added utilizing the NHL API draft endpoint.
-
Player line combinations were created from the NHL shift charts API
-
The database was hosted on Neon, a serverless Postgres platform.
Structure
Tables
-
seasons
One row per NHL season (2005-06 onward). Stores the season ID (e.g. 20052006), start/end years, rule flags (wild card, ties, OT loss point), and key dates (regular season end, playoff end).
-
teams
One row per NHL franchise entry. Stores the team's numeric ID, full name, three-letter abbreviation, and franchise ID.
-
team_seasons
Junction table linking teams to seasons. Each row represents a team participating in a given season and stores end-of-season standings data: wins, losses, OT losses, points, and a reference to the division. Its primary key (id / team_season_id) is the FK used throughout the rest of the schema.
-
players
One row per NHL player. Stores the player's numeric ID, first/last name, birthdate, birth country, shoots/catches handedness, and amateur league (the last non-NHL/AHL league the player appeared in before turning pro).
-
rosters
Links players to a specific team-season. Stores jersey number, position code, height (inches), and weight (pounds). A player can appear on multiple team_seasons rows (trades, multiple seasons).
-
conferences
One row per conference per season (e.g. Eastern, Western). Stores the conference name and the season it belongs to. Created on-the-fly when standings are inserted.
-
divisions
One row per division per season (e.g. Atlantic, Metropolitan). Stores the division name, its parent conference, and the season it belongs to. Created on-the-fly when standings are inserted.
-
player_stats
Regular-season skater stats (game_type_id = 2) per player per team-season. Stores goals, assists, points, plus/minus, average time on ice, penalty minutes, and games played. Goalies are excluded.
-
player_stats_playoffs
Playoff skater stats (any game_type_id other than 2) per player per team-season. Same columns as player_stats. Goalies are excluded.
-
playoffs
One row per season that had a playoff. Acts as a parent record for playoff_series rows, keyed by season_id.
-
playoff_series
One row per playoff series (e.g. first-round matchup). Stores the round number, series letter (A–O), the home and away team_season_ids, and each team's game wins within the series.
-
playoff_games
One row per individual playoff game. Stores the parent playoff_series_id, game number within the series, home/away team_season_ids, and final scores for each team.
Relations
-
seasons
-
conferences
-
divisons
-
team_seasons
-
rosters
- players
- player_stats
- player_stats_playoffs
- playoff_series
- playoff_games
-
rosters
-
team_seasons
-
divisons
-
teams
- team_seasons (see above)
-
playoffs
- playoff_series
-
conferences
Automation
How the database is kept up to date
The database is updated daily with new data from the NHL API. A Python ETL pipeline is used to fetch new data and update the database. Unique identifiers, such as player ID and team ID, are shared between the NHL API and the database to ensure that data is updated correctly.
-
The ETL pipeline is scheduled to run daily using GitHub Actions.
-
The pipeline fetches new data from the NHL API and updates the database with any new or changed data for the most recent season.
02
SkipUI/UX Design
Sitemap
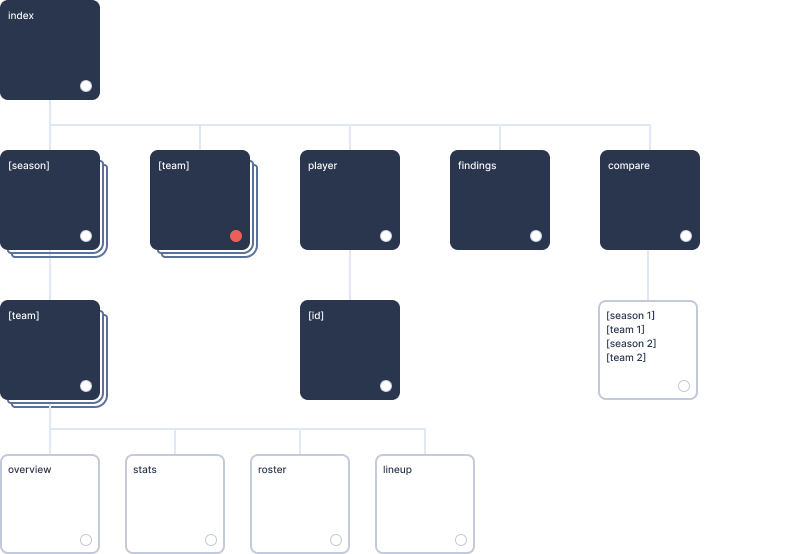
Not many routes were needed to satisfy client requirements. The particular interest was in the team lineup and team comparison pages.
Unique design challenge
An old-fashioned design to emphasize an old-fashioned view of statistics
The client wanted the interface to resemble a newspaper to reflect a more traditional approach to statistics. The challenge was to create a modern, responsive layouts that had the same feel as traditional printed media.
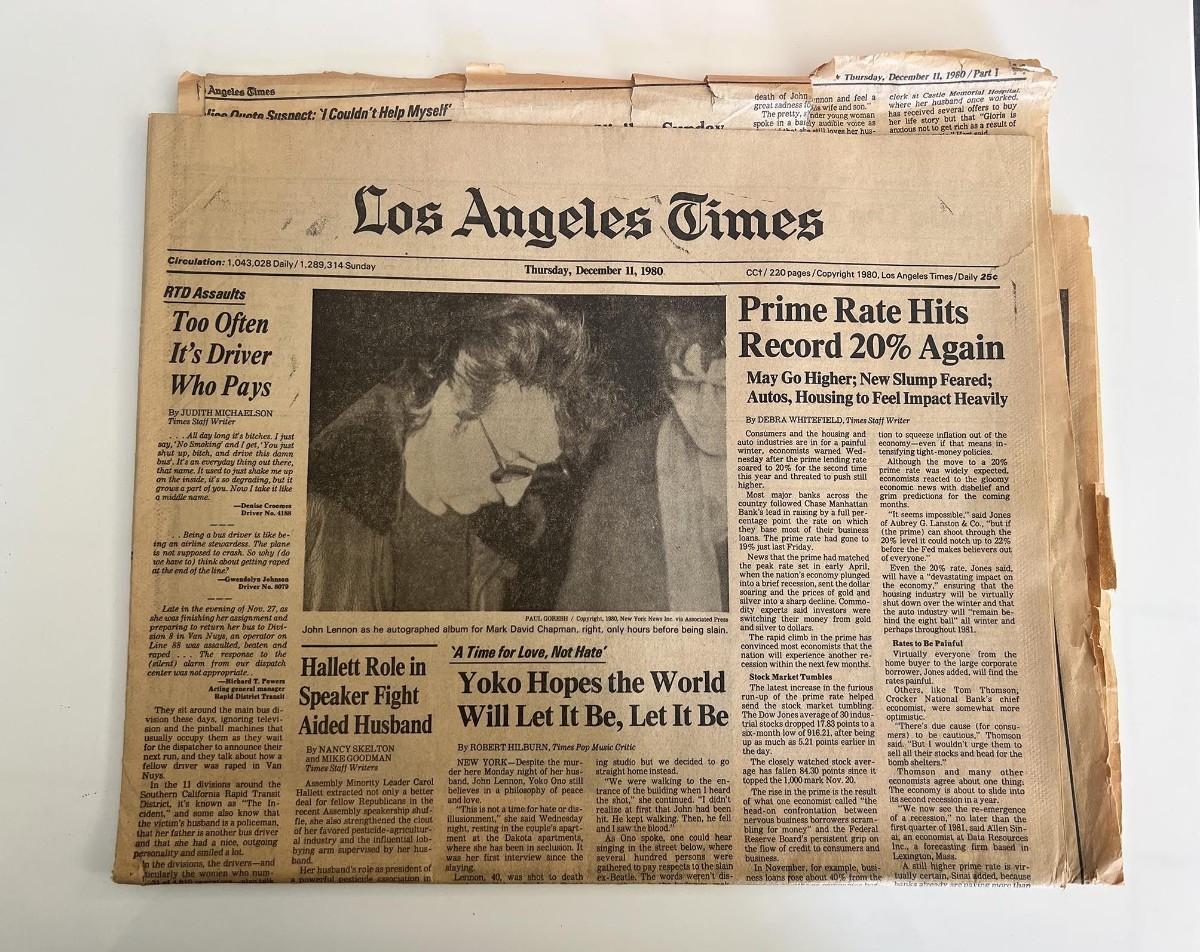
Images of newspapers were collected and utilized for reference and inspiration. The design was then iterated on to create a modern, responsive layout that had the same feel as traditional printed media.
Design elements
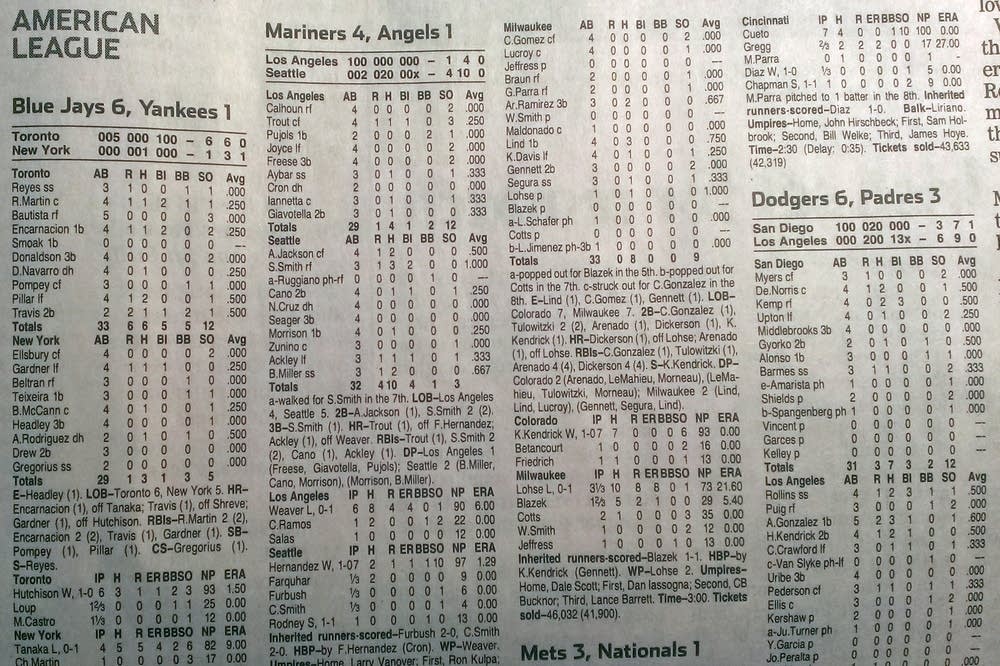
Common design elements were identified accross traditional printed media.
- Serif fonts
- Thick horizontal and vertical rules
- Multiple column layout
- Rigid grid structure
- Large headlines
- Justfied text
- Minimal to no color
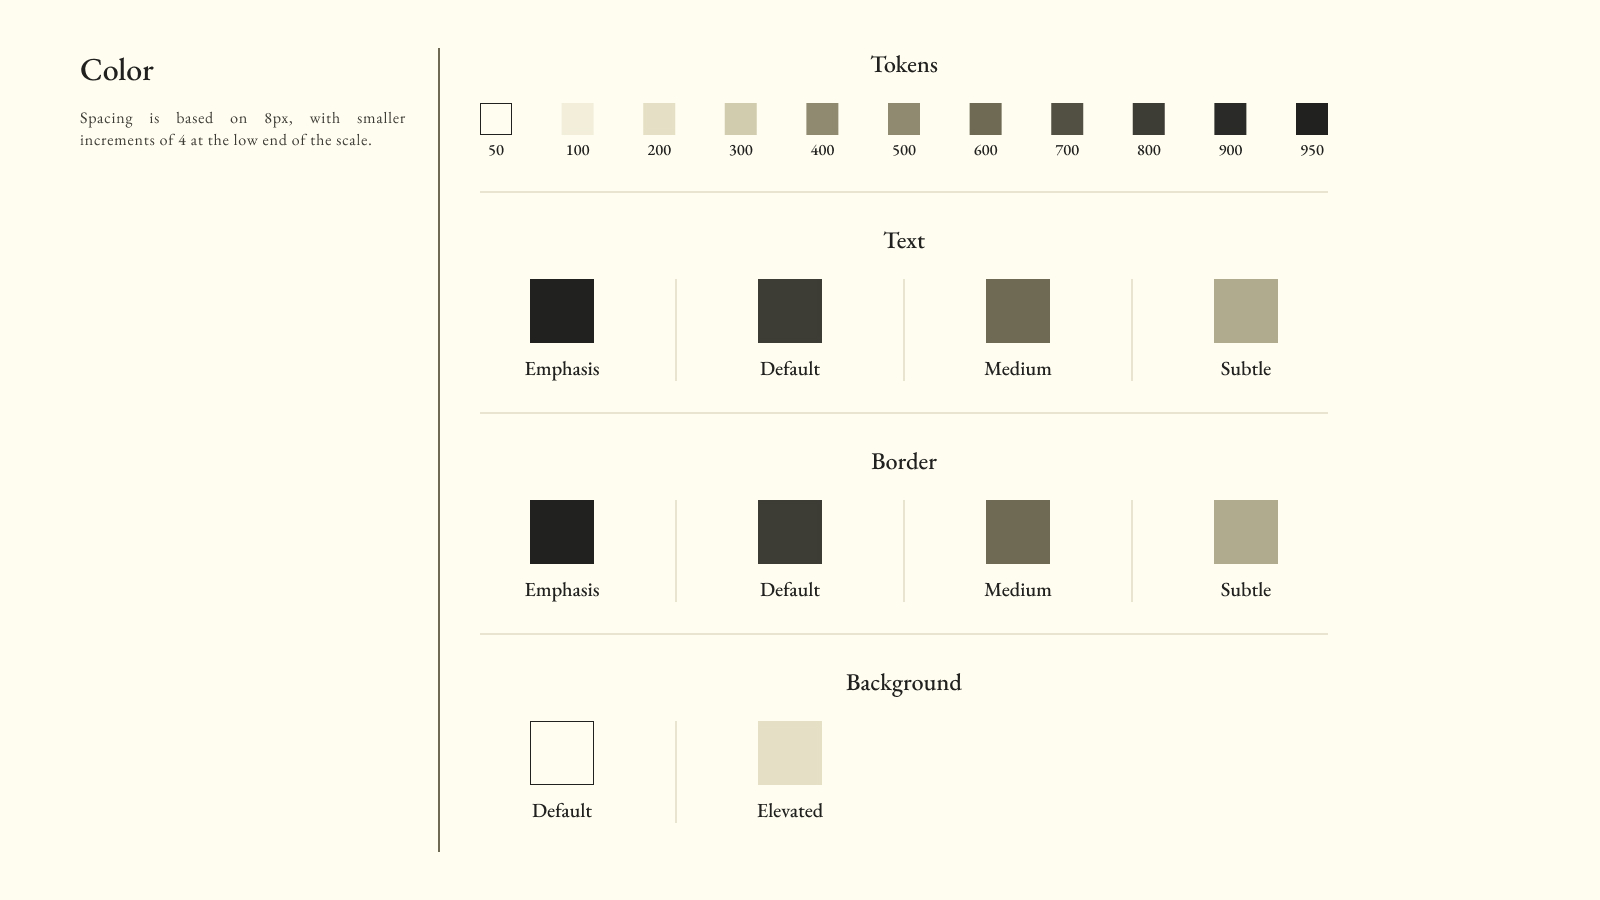
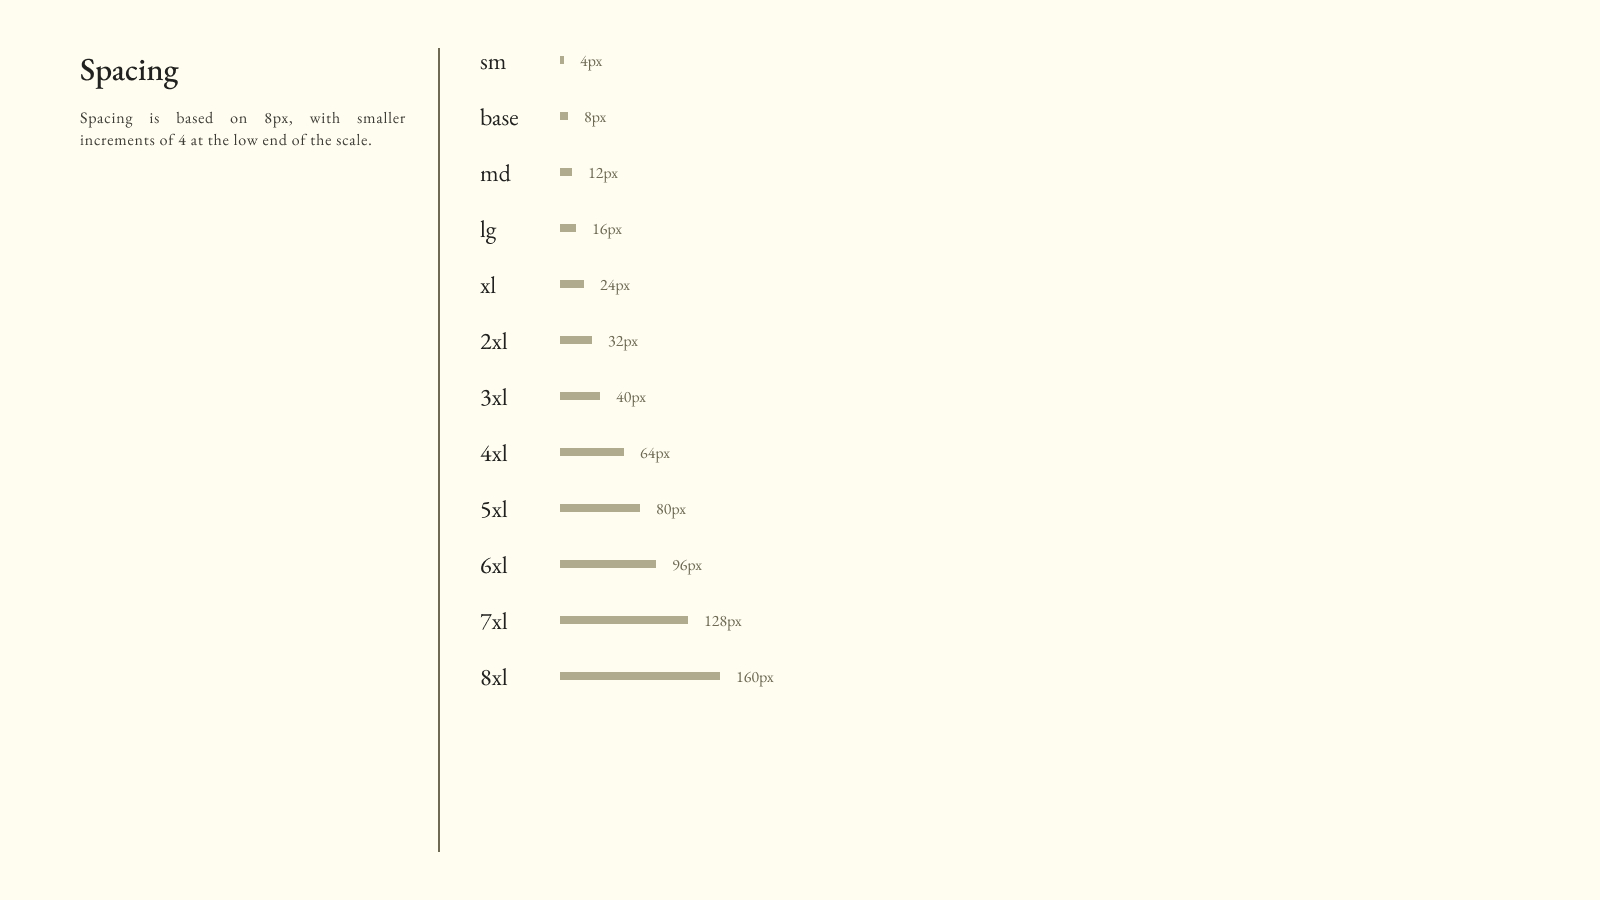
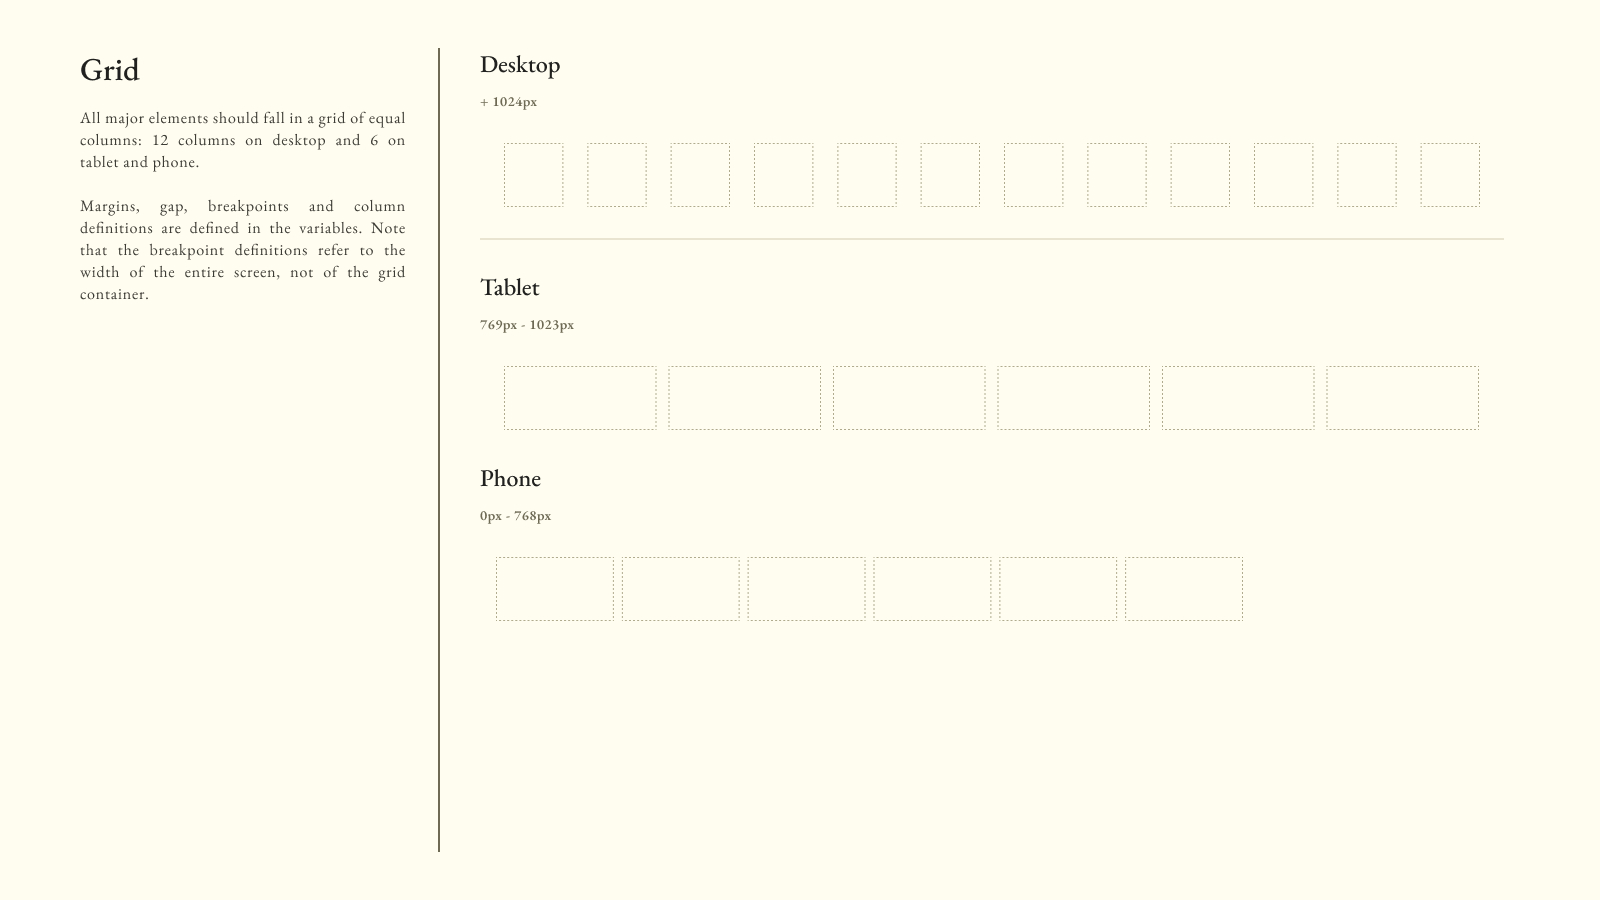
Design Tokens
The design tokens were defined in Figma utilizing variables.

Concept and base layout
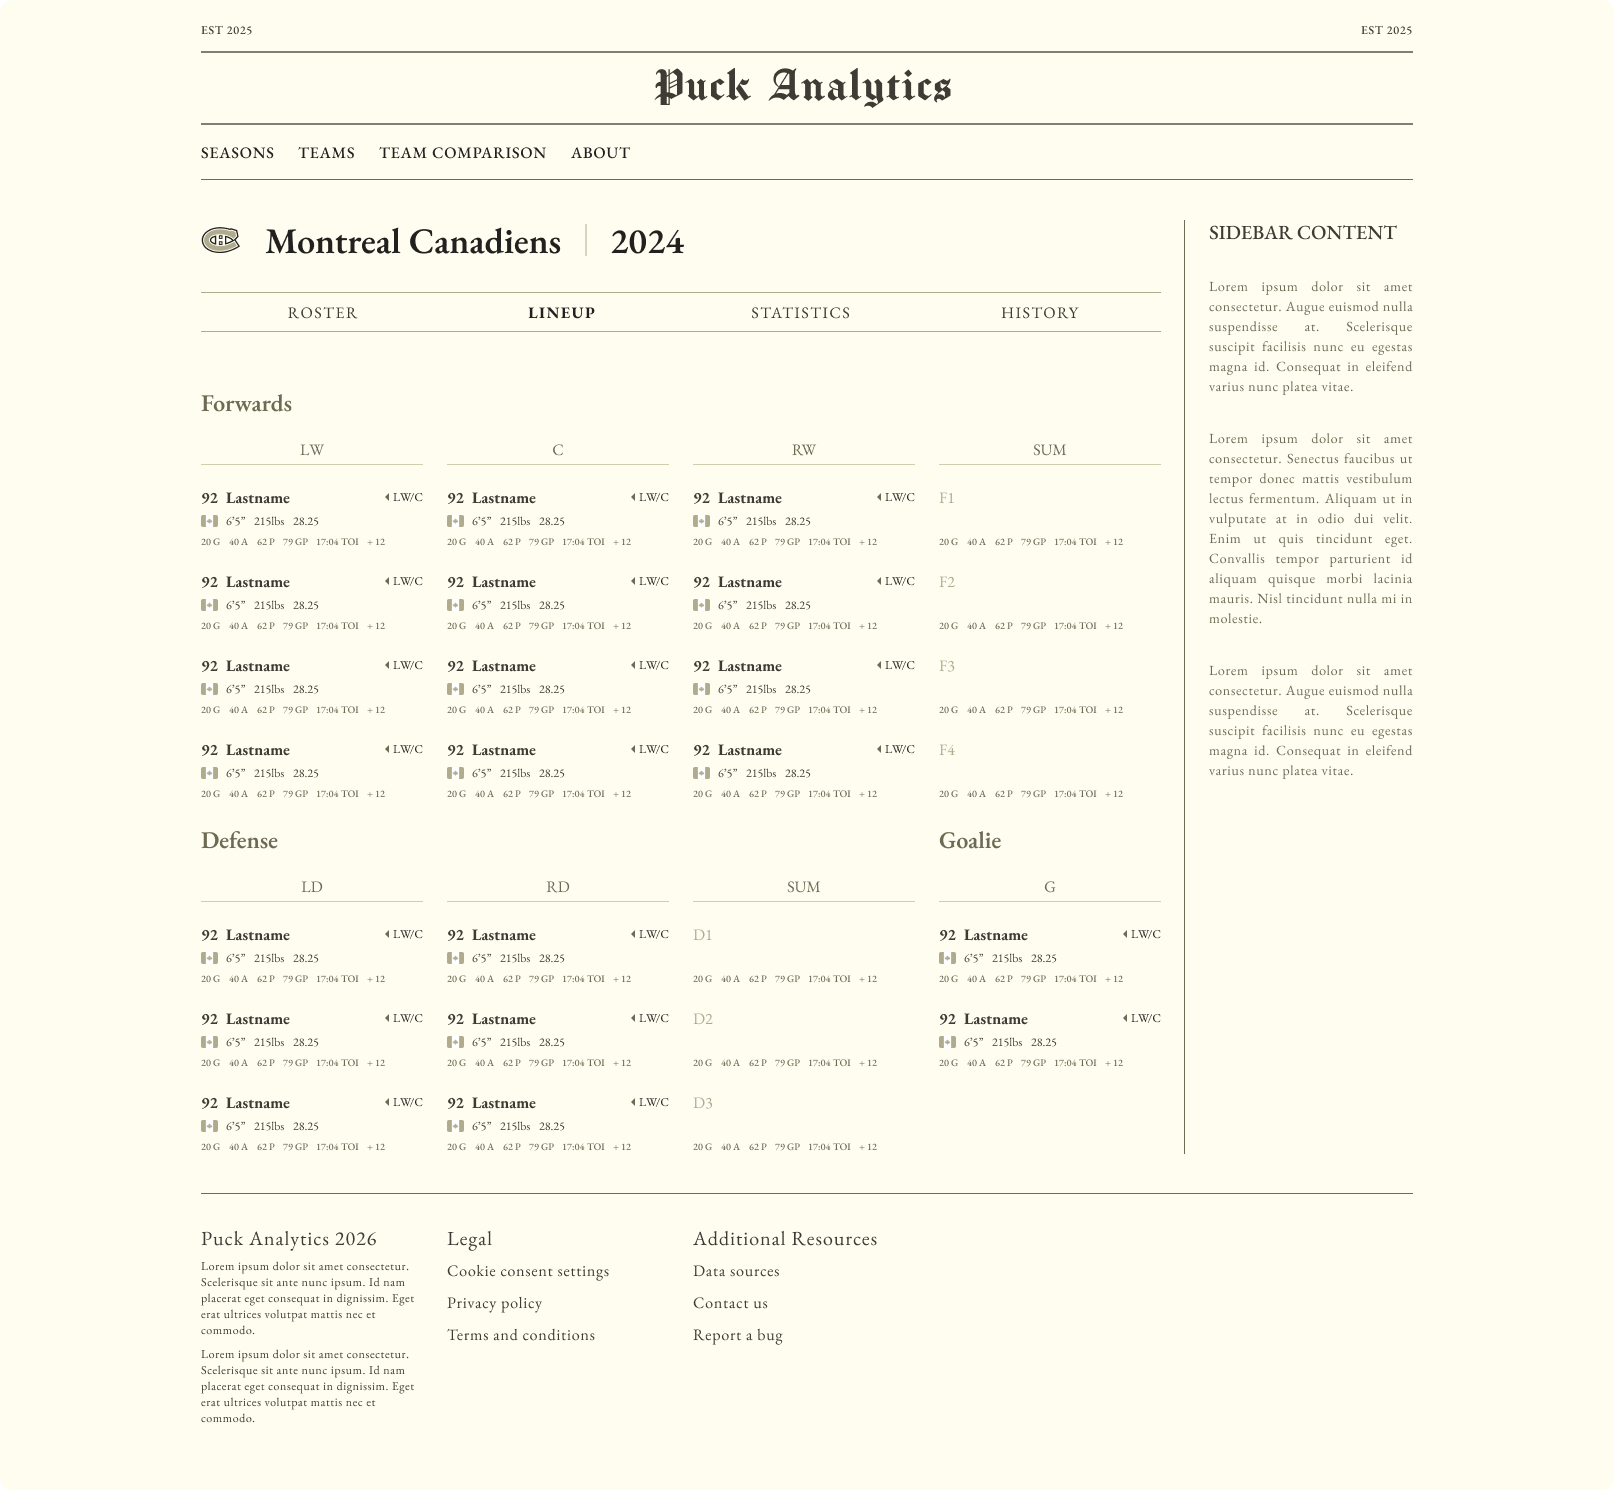
An example page layout demonstrating the base style, layout, navigation, and design principles was presented. The base layout was created in Figma utilizing slots and grid auto layout, with variants for desktop and mobile views.

03
Development
Tech stack
Application

Next.js

React

TypeScript

Tailwind CSS
Visualization
D3.js
Infrastructure

Neon

Vercel
Data architecture
From raw API data to interactive dashboard
The application layers two data sources through Next.js server components before reaching the browser — a pre-built PostgreSQL database for roster and standings data, and live NHL API calls for per-game shift chart data.
-
NHL Stats API
Live shift chart data fetched per-game to reconstruct line combinations.
-
Python ETL
Ingests and normalizes roster, standings, and playoff data from the NHL API into PostgreSQL.
-
PostgreSQL on Neon
Persistent storage for all historical season, team, player, and playoff data.
-
Next.js server components
Query the database and NHL API at request time — data arrives fully rendered with no client-side loading states.
-
React + D3
Interactive client components handle navigation and D3-powered chart rendering.
Lineup algorithm
Reconstructing line combinations from shift data
The NHL does not publish an official lineup API. This algorithm infers line combinations from the shift chart endpoint, which records each player's exact on-ice intervals throughout a game.
- 1
Fetch shift chart
All player shifts for the team's most recent game are requested from the NHL shift chart endpoint, providing each player's on-ice intervals to the second.
- 2
Filter to 5v5 regulation
Shifts outside of regulation 5-on-5 play are discarded. Power plays, penalty kills, and overtime are excluded to isolate even-strength deployment patterns.
- 3
Detect and remove goalies
Goalies are identified by position code and shift-duration heuristics — goalies take long continuous shifts while skaters rotate frequently.
- 4
Rank by ice time
Skaters are ranked by total 5v5 time-on-ice. The top 12 forwards and top 6 defensemen form the pools for line and pairing construction.
- 5
Compute co-ice time
For every pair of skaters, the total seconds they shared the ice is calculated. High co-ice time identifies players the coach regularly deployed together.
- 6
Build forward lines
The highest-TOI forward seeds each line. Remaining forwards are slotted by position preference (C → LW → RW, filling gaps as needed), weighted by co-ice time to form 4 complete lines.
- 7
Build defensive pairings
Defensemen are paired by handedness — a left-handed and right-handed defender per pairing — matched by co-ice time to construct 3 pairings that reflect actual deployment.