Kardia.com path-to-purchase
Optimizing the user journey on kardia.com
Improving the conversion rate of kardia.com by optimizing the user journey and clarifying the differences between devices.
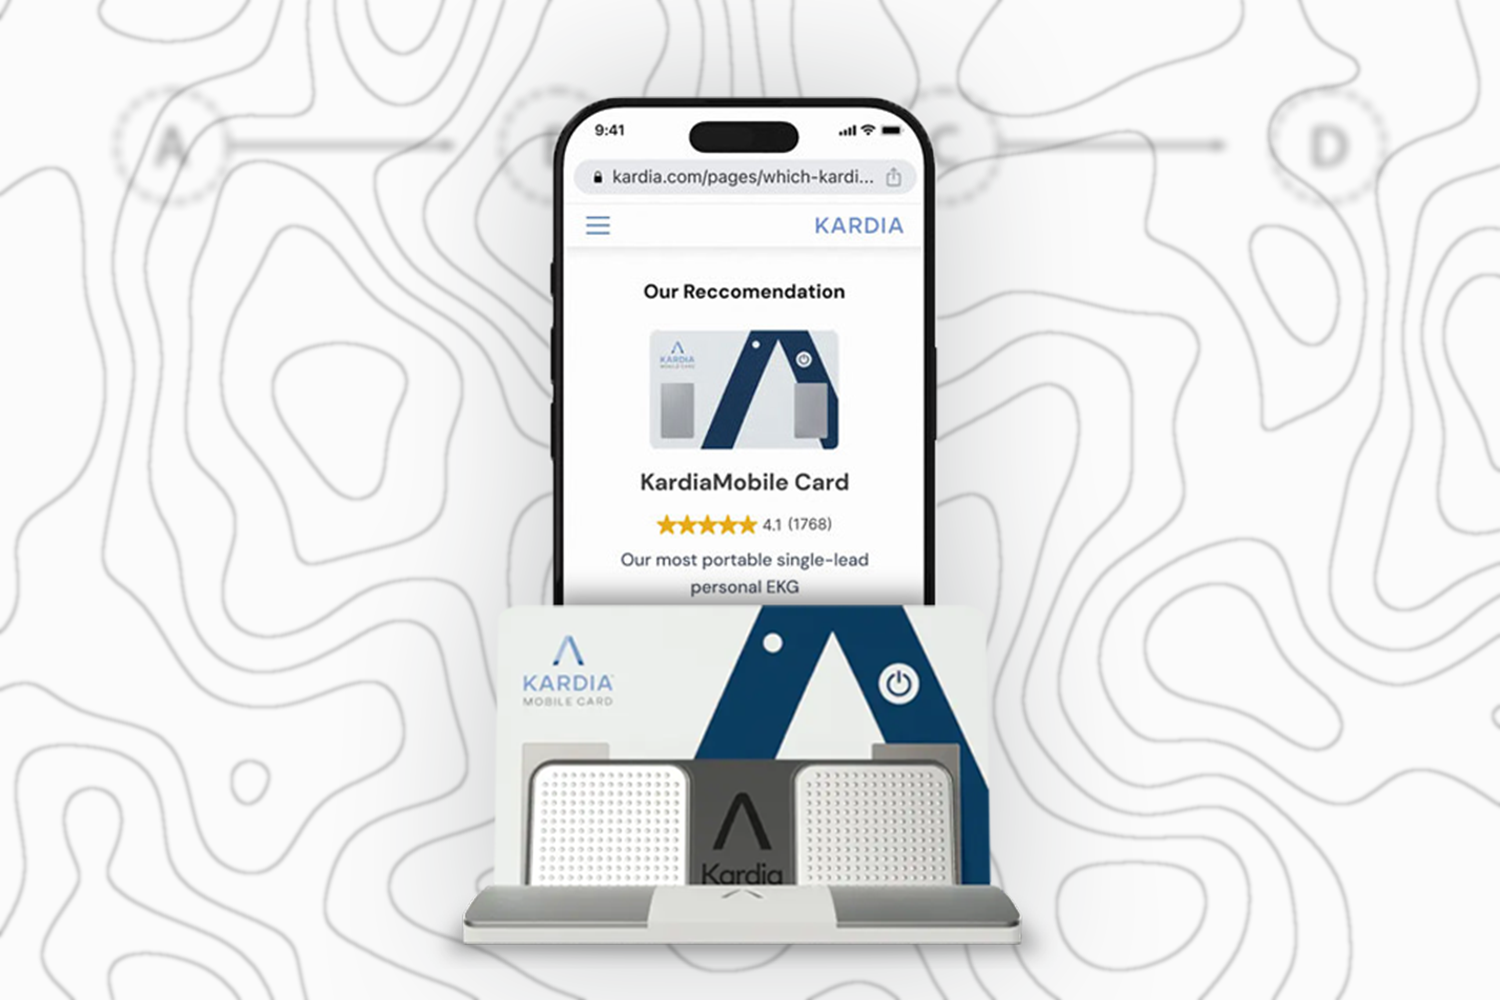
There weren't many options but I still didn't know which one was right for me."- Kardia.com visitor, 2025
Researcher, Designer & Developer
Kardia
Mar 2024 – Jan 2025
Problem
Users were having difficulty distinguishing between different devices and selecting the best one for their needs.
Solution
The existing product comparison chart was redesigned to clarify the difference between products and add missing information that customers deemed important. Based on its success, a three question quiz was created to guide users to the device that best suited their needs.
Steps
User research
Conducted user research to identify pain points in the user journey and areas for improvement.
Comparison chart
Designed a new user interface and experience to address the identified pain points and improve user engagement.
Product quiz
Implemented the new design and conducted A/B testing to measure its impact on user engagement and conversion rates.
01
SkipUser research
Google Analytics and HotJar
Users were frequently scrolling up and down the comparison chart and navigating between multiple pages to find information.
90%
Of site views reported in Google Analytics were from first time visitors
>40%
Of users visit the same product page multiple times per session
82%
Of sitewide traffic is from mobile devices
User surveys
A survey was embedded on the product pages, and a post purchase survey was also sent to customers who purchased a device.
>50%
Were confused about the differences between products
27%
Of desktop responders found the comparison chart difficult to understand
59%
Of mobile responders found the comparison chart difficult to read and understand
57%
Of KardiaMobile purchasers purchased KardiaMobile because it was the cheapest option
Previous A/B tests
Previous A/B tests were referenced to guide the design of the new comparison chart.
1
Add short descriptions to product listings on the store homepage
2
Add tags such as CUSTOMER FAVORITE and BEST VALUE to product listings on the store homepage
+11%
Conversion rate increase from test 1
+17%
Conversion rate increase from test 2
+7%
Increase to average order value from test 2
Takeaways
- Revenue is being lost as users are purchasing the cheapest device because they don't understand the value of the more expensive devices.
- The current comparison chart is not easily understood on mobile devices.
- Providing clear and concise information about product differences is crucial for helping users make informed purchasing decisions.
- The vast majority of users are new visitors, so the path-to-purchase needs to be designed with first-time users in mind.
02
SkipComparison chart
Previous design
The former comparison chart did not provide enough information about the devices, and the three column layout was too difficult to read on mobile devices.
Areas for improvement
- Make the titles and images of the products sticky on the page so the user always knows which product they are looking at, even when the page is scrolled.
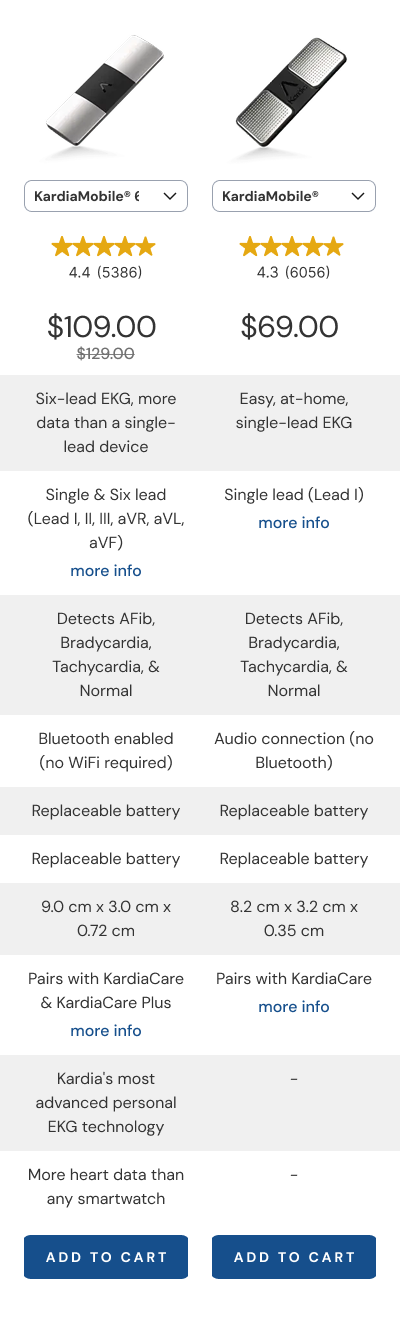
- Reduce column layout on smaller screens to two for better readability.
- Expand the list of features to better differentiate the differences between devices.
- Place the add to cart button on the bottom of the chart. Users who are at this point in the user journey are not yet ready to purchase. Lowering the add to cart button will enable users to ingest more information versus having them feel rushed into a decision.
- Product review stars are not included.
Redesign
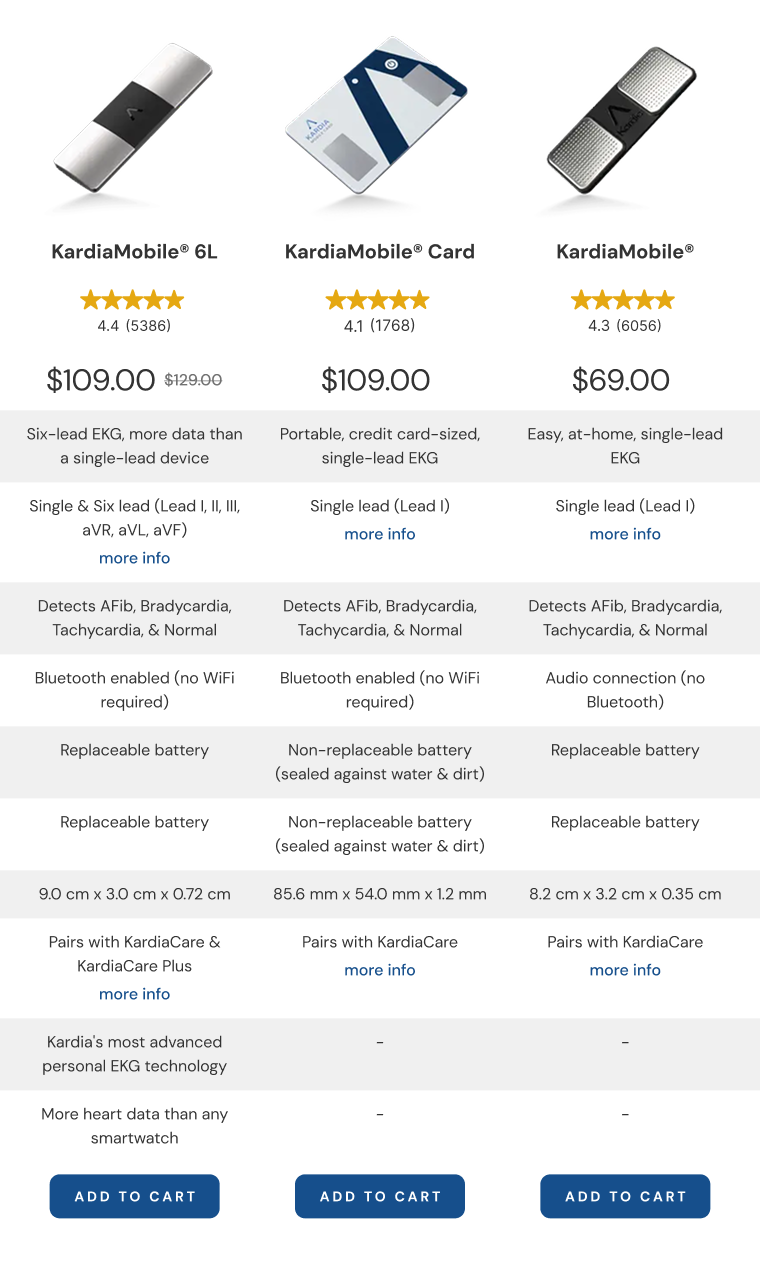
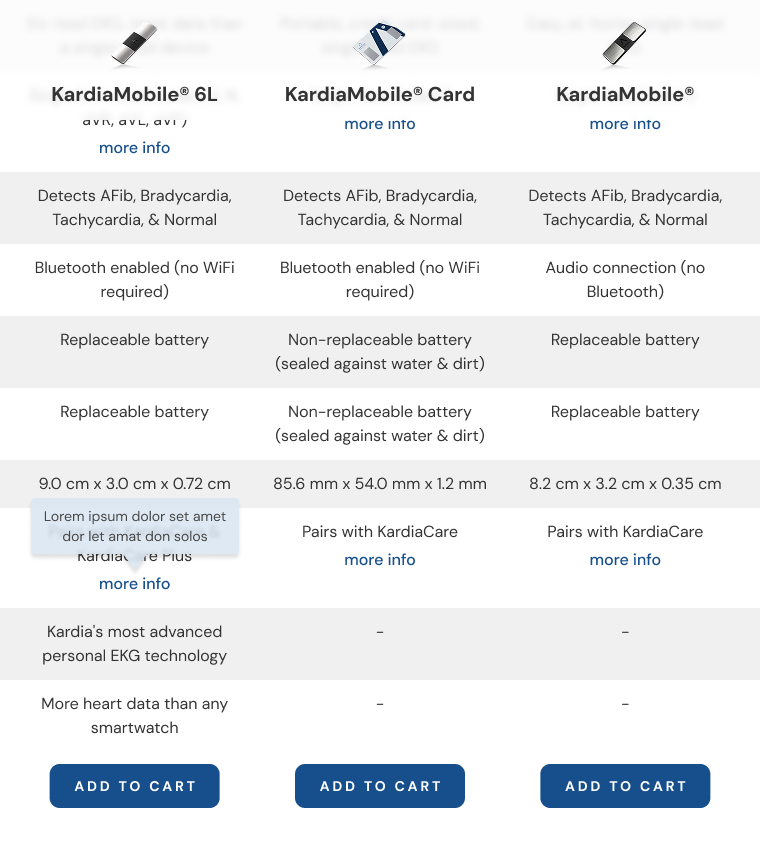
The new comparison chart provides more information about the devices, and the two column layout is easier to read on mobile devices.
Wireframes
High fidelity wireframes were created to explore different layouts and information hierarchy for the new comparison chart.
Figma designDesktop
Desktop (scrolled)
Recordings & links
Results
The design was A/B tested against the previous design. The metrics displayed here showcase performance versus the control during the 40 day test period, as well as projections in revenue based on this performance.
Based on its success, a direct link to a designated page to compare products was created. 12% of visitors who visited the comparison chart page purchased, making it the highest converting page on the site.
+2.3%
Conversion rate
+6.2%
Average order value
+7%
Revenue
+$11.5k
Revenue per month
-3.6%
Returns per month
-12%
Session U turns
03
Product quiz
Purpose
Despite the improvements from the new comparison chart, users, particularly users purchasing the device as a gift, were still having difficulty selecting the best device for their needs. A short quiz was created to guide users to the device that best suited their needs.

Customer survey
A survey was sent to customers who purchased a device to determine the most important factors in selecting a device. The survey was designed to be short and simple, with three questions that would guide users to the best device for their needs.
Quiz structure
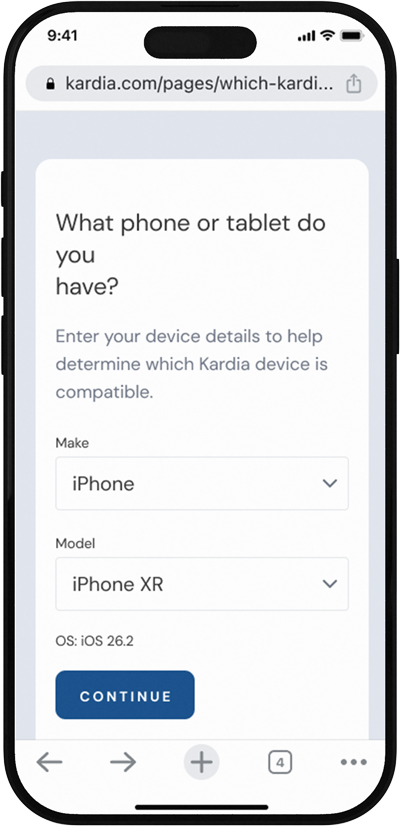
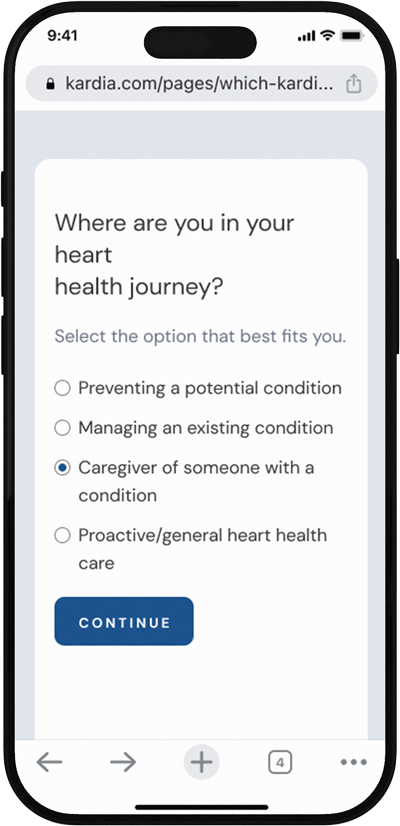
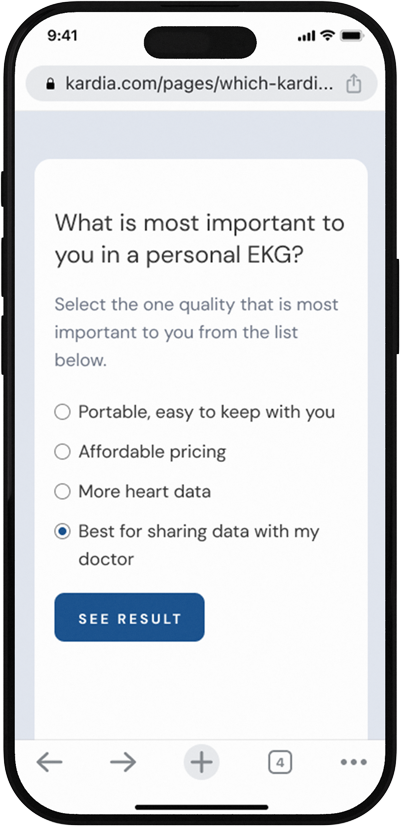
The quiz was designed to be short and simple, with three questions that would guide users to the best device for their needs. Customers who previously purchased were surveyed to determine the most important factors in selecting a device, and the questions were designed to cover these factors.
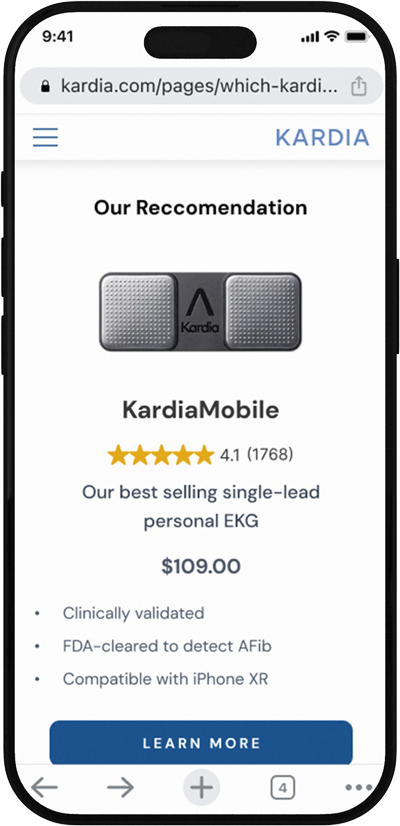
Each answer was assigned a score that would be tallied at the end of the quiz to recommend a device. The questions were designed to be broad enough to cover a wide range of user needs, while still being specific enough to provide meaningful recommendations.
| ↓ Q1 / Q2 → | Portability | Affordability | Extensive data | Ability to share results with a doctor |
|---|---|---|---|---|
| Preventing a future condition | KardiaMobile Score: 3 | KardiaMobile Score: 4 | KardiaMobile 6L Score: 5 | KardiaMobile 6L Score: 5 |
| Managing an existing condition | KardiaMobile Score: 4 | KardiaMobile 6L Score: 5 | KardiaMobile 6L Score: 6 | KardiaMobile 6L Score: 6 |
| General heart care | KardiaMobile Card Score: 2 | KardiaMobile Score: 3 | KardiaMobile Score: 4 | KardiaMobile Score: 4 |
| I am a caregiver purchasing for someone else | KardiaMobile Card Score: 2 | KardiaMobile Score: 3 | KardiaMobile Score: 4 | KardiaMobile Score: 4 |
The smartphone question only comes in to play if the users phone is incompatible with the device that they are being recommended. In this case, the user will be recommended the device that is compatible with their phone, regardless of their score. If no device is compatible with their phone, the user will be recommended to contact Kardia support for assistance.
User interface
results
The device quiz was A/B tested by displaying a link to it on the store homepage. The performance of the page was also measured, and these showed that the quiz was in most statistical respects the strongest performing page on the site.
+120%
Conversion rate vs product pages
+3.5%
Revenue
+6.5k
Revenue per month
+8%
Session length
31%
Purchase rate for users who completed the quiz
Next steps
Follow up items to continue improving the user journey and conversion rate on kardia.com.
- Increase traffic to the quiz. Its strong performance could be due to the fact that only high intent users are clicking on the link to the quiz. Increasing exposure could help validate its effectiveness.
- Test different questions, length, and order of the quiz to optimize for conversion rate.
- Embed the quiz on the product pages, or display it as a pop-up to increase visibility and engagement.
- Experiment with different layouts of the comparison chart.
- Conduct user surveys to gather feedback on the new comparison chart and quiz.